Hello - With COVID I have been WFH a lot and have eve running in the background running. I’m keeping an eye one it - but I’m trying to find something (or learn how to create something) that will esentially just keep targeting astroids and send drones to mine. I’m doing all the warping and figuring out where to mine and unload, but just want it to keep targeting and keep mining so I don’t have to keep coming back.
I also run several clients at once… just for fun…
I’m confused as to how to get started though and would appreciate any help.
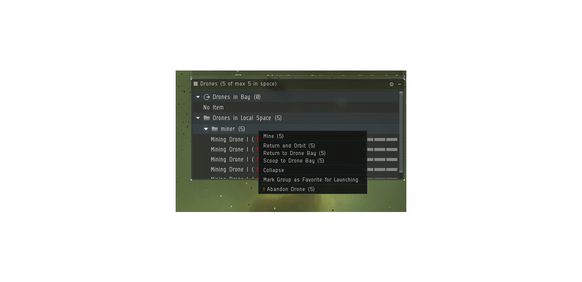
One way to start is by recording the inputs that you sent to the game client. For example, if you want to engage drones, you could start like this:
Step one: Right-click on the drones group in the drones window.
Step two: Click on a menu entry containing the text “engage”.
With your specific activity, you can take a shortcut and skip this step because there are already building blocks for locking asteroids and engaging drones. There is already a comprehensive framework for EVE Online that gets you there 97% of the way.
To write a program to automate these behaviors, I search the catalog for these functions and combine them into a new app. To find a building block to engage drones, I search for a ratting bot and find this one: FrontendWeb.Main
In this bots source code, I find this function to launch and engage drones:
In this function code, we also see the behavior to engage the drones described above.
To make a new bot, we can copy one of the existing popular bots and replace the decision tree’s root. Using a decision tree to pick the next action is a typical pattern that you find in mining, ratting, autopilot, and other bots. These different kinds of bots share the same language/type to describe the outcome of a decision tree so that we can copy branches and reuse them in other apps.
We can copy this function as-is and use it at the root of the decision tree. (We don’t need to worry about the branch for launching drones, because the bot will only enter it if necessary.)
I took an autopilot bot, replaced the decision tree root, and removed obsolete code. Here is the result: FrontendWeb.Main
For mining it is not engaging target it is just mine it seems to be looking for engage target in the drone sub window but its just simply mine or just use the shortcut key for drone engage which is f
Since this variant became popular, I used it as an input for a new variant supporting input focus scheduling and the latest engine version.
With this merge, you can use the variant from @Mactastic08 and @annar_731 with the engine version 2020-12-07 and newer. (Input focus scheduling is automatic).
I checked out this branch, but my problem is that I have no access to the actual Groups, i.e., I assign drones to a group but I have no access to that in the ParsedInterface therefore cannot tell the bot to select a specific group of drones.
There is droneGroupInBay but it does not actually contain any groups, only the ungrouped drones.
I browsed the UI Tree an what I am looking for is the DroneSubGroup but I have no idea how I can access that easily.
ᐯdrones = List (8)

ᐳ0
ᐳ1
ᐳ2
ᐳ3
ᐳ4
ᐳ5
ᐳ6
ᐳ7
Am I missing something?
If I understand this correctly I need to adjust the ParseUserInterface.elm to parse/add what I need
Can you see the thing in a screenshot?
Do you see it in the visualization of the raw memory reading?
If it is visible in the raw memory reading but not in the parsed, the solution is to adapt the parsing function.
Depends on the reading from your game client. If you link your reading I can look into how you could access it.
When you run an app using the run or simulate-run command, the engine logs everything by default.
In both cases, sessions on live game clients and simulations, you will get a new session entry in devtools.
The simplest way to view the logs is by using the graphical user interface in devtools.
(If you used the --detailed-session-recording=off option in a session, the logs will not be available for that session)
Thx for the quick reply.
I haven’t tested my adapted Parser yet. I still need to learn how to execute my code in a simulation instead of the real client.
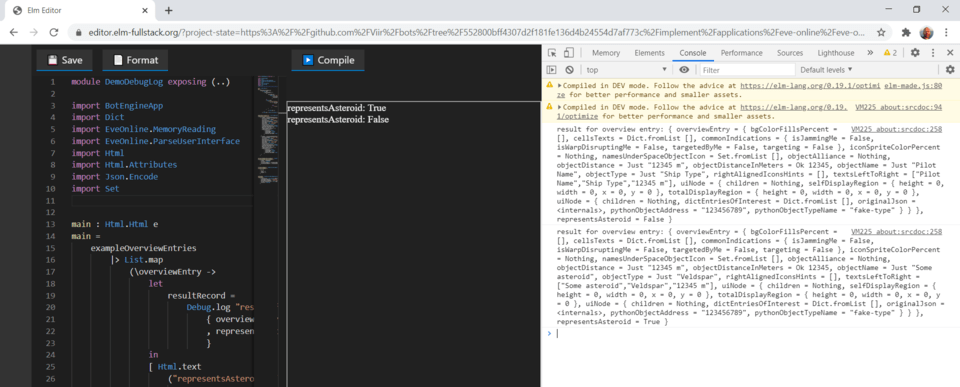
Is there another way to print debug information like pythons print or do I have to nest describeBranch calls? I would love to be able to print the stuff that I wrote to the console somehow
Ok. Going to check that. But that means I need to write into the context so that this function can read it from the context. I guess there is no direct way to log at any arbitrary code point.
Sorry, I used the wrong word “log” instead of “extract” in the earlier post.
You do not need to write to that context because everything is logged automatically.
When you run an app using the run or simulate-run command, the engine logs everything by default.
In both cases, sessions on live game clients and simulations, you will get a new session entry in devtools.
The simplest way to view the logs is by using the graphical user interface in devtools.
(If you used the --detailed-session-recording=off option in a session, the logs will not be available for that session)
The statusTextFromState is one way to extract text from the raw log. For example, when you feed a session log into a simulation, you can easily extract more text this way.
What do mean by log everything?
I am constructing a specific list of DroneSubGroup items and I want to log that. I would need to use Debug - core 1.0.0
I doubt that the engine just logs every variable value by default?
Thank you very much so far. I am going to try and apply those things, but when I run botengine simulate-ru mylocalcode with a session I recorded I do not see the debug output anywhere.
The botengine devtools however do not display any of that debug output.
If I understand it correctly the only way to get log information out is via the describeBranch i.e., sending the information per tick to the c# host which automatically displays it.
Debug.log works fine for a regular elm App in a browser but the bot does not run in the browser it runs in a c# js VM if I read the code correctly.
 it seems to be looking for engage target in the drone sub window but its just simply mine or just use the shortcut key for drone engage which is f