Yes, by default, not all logged data is displayed.
The default display is optimized for operation and not for development. It only shows the part that you decided is important for normal operation when writing the program code. This part is the string you assign to the statusDescriptionText field
Nope, I see at least two differences in actual implementation:
describeBranch is specific to your app, it does not exist in every app the automatically displays something. If you want to display something to the user/operator, use the statusDescriptionText field
All information from your app run is written into files by default. The engine creates one directory per session in %localappdata%/botengine/run-app-session (This applies to both live sessions and simulations). The session recording archive in the graphical user interfaces automates packaging all files of one session in a single file. This is the data source you reach for when the text for the user/operator is not enough. The botengine devtools then help you work with your data with graphical user interfaces for interactive exploration and visualization.
Yes, the Debug.log setup I made there is only for cases running in a web browser.
One way of using this setup is analogous to automated testing. However, there is also a dedicated test runner that forwards the data from Debug.log, so you could use the elm-test-rs test runner instead in those cases.
There is another way to use Debug.log, which is especially interesting for EVE Online developers: Since the alternate UI runs in web browsers, you get the Debug.log entries in the alternate UI. The alternate UI, in turn, is a good entry point for all cases where you work on parsing the reading from the game client.
On the other hand, when you work on parsing the reading from the game client, using an automated test setup is often more efficient than inspecting logs. I see some examples in this file:
Thank you very much, I have gotten further by trial and error, also got stuck on a few elm/type issues that I got resolved now.
I looked at everything you provided.
However, I still see now way to having a debug mode for the bot, where I can dump or view everything. I looked into the %appdata% folder and I could not see the raw output that the elm program actually produces when running inside the C# JS VM (e.g., terminal output/Debug.log output).
So I thought about using file 1.0.5 for now to write everything I want to a local file.
My question would be whether the (1) JS VM actually allows using that functionality?
(2) Also, is there some sort of debug mode planned that can be enabled so we can make use of Debug.log when running simulations etc.
The engine creates a new directory for each session in %localappdata%/botengine/run-app-session. The engine also saves the app program code of this session and all app events in this directory. To get the output of the Elm app, we apply the app to the list of events. (An app is a function). The current version of the engine also writes the evaluated return values in the session log directory. This information is redundant. The redundant store costs some space on the file system but allows us to get that result again without repeating the function application’s computation.
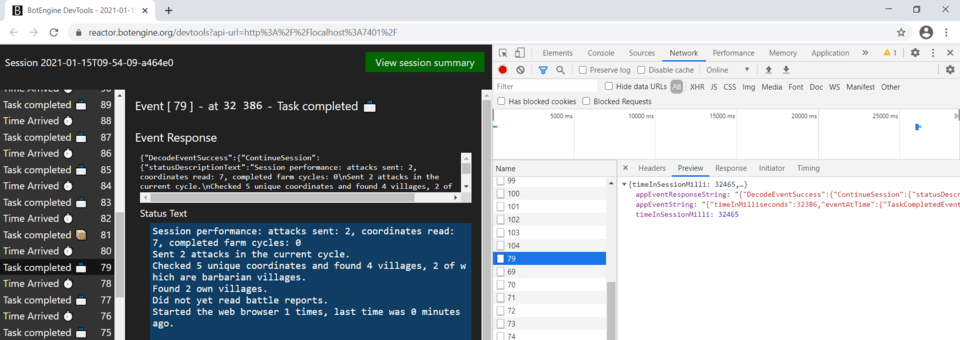
To get the return values from the app, you don’t have to parse the files, as the devtools already implement that parsing step and provide a JSON structured view:
Nope, that package is for apps that run in a web browser. That package uses the Task and Cmd API for frontend web apps, which is not implemented in botengine.
In the alternate UI for EVE Online, there is an example of using File.Download in such an app:
Not so far, but plans change all the time. In any case, I continue to make tools to support bot development.
If we find a case where Debug.log helps with bot development, I will look into it.
For the development of memory reading parsing functions, Debug.log seems to work already when we run the program using elm-test-rs or run it in a web browser.
For the case of adapting the parsing of the drone window to your game client, using an app simulation is overkill anyway. The alternate UI offers an entry point to run a simulation specifically for memory reading parsing. The parsing runs every time you load a file into the alternate UI. That seems easier than running a whole app simulation. When you use the alternate UI as the entry point, you see the effects of Debug.log in the ‘console’ tab of the web browser devtools.
Thx for the additional tips. One additional question is the elm http functionality working within the bot, i.e., can I make http calls in the elm part of the bot? HTTP · An Introduction to Elm