@Viir Is it possible to only request that the sensor only retrieve certain values in a measurement, rather than the entirety of the process’s memory space? If so, would this be faster/less CPU intensive? Thanks!
Yes, this can be done by adapting the memory reading code.
This depends on the chosen scenario.
There are multiple possibilities to only retrieve certain values, and some of those need less CPU processing time.
How trivial/difficult would that modification be for a C#? Could you point me towards where in the code base I could look to make those modifications?
@Viir here’s an issue I’m having:
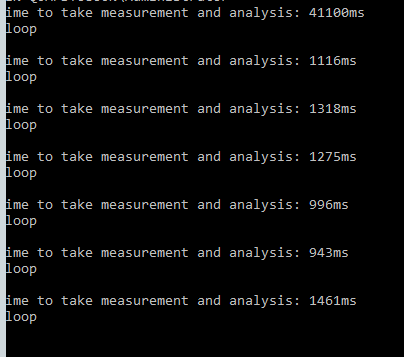
Here’s the code that generates that console write:
for (; ; )
{
var stopwatch = new System.Diagnostics.Stopwatch();
string totalTime;
stopwatch.Start();
var response = sensor?.MeasurementTakeNewRequest(eveOnlineClientProcessId.Value);
stopwatch.Stop();
totalTime = stopwatch.ElapsedMilliseconds.ToString();
Console.Write("Time to take measurement and analysis: " + totalTime + “ms\n”);
if (null == response)
continue;
///Console.WriteLine(“Sensor Interface not yet ready.”);
else
MeasurementReceived(response?.MemoryMeasurement);
Thread.Sleep(MeasurementTimeDistance);
}
Is there a faster way to take a measurement? That is way, way slower than expected, and practically unusable for what we’re trying to do. This is on my host, an i7-4790K, GeForce 980Ti 6GB, 32 gigs of RAM, Eve turned to lowest settings. Before, you’ve said this takes <300ms. I would love your help!
It’s easy, I suggest the following experiment:
Take the sanderling source code from commit 9260427081b0dc5cd5a9794292a1696464c36198 and delete the code from the following locations:
- Sanderling/src/Sanderling/Sanderling.MemoryReading/Production/MemoryMeasurement/SictGbs/VonKlientBerictProzesZuusctandAuswert.cs at 9260427081b0dc5cd5a9794292a1696464c36198 · Arcitectus/Sanderling · GitHub
- Sanderling/src/Sanderling/Sanderling.MemoryReading/Production/MemoryMeasurement/SictGbs/VonKlientBerictProzesZuusctandAuswert.cs at 9260427081b0dc5cd5a9794292a1696464c36198 · Arcitectus/Sanderling · GitHub
Then build from the resulting source to compare to the version from commit 9260427081b0dc5cd5a9794292a1696464c36198.
This change should be sufficient to make the object modeling the ShipUI disappear from the memory measurement.
@Viir Thanks, I’ll give this a try!
Did you see my post above where the measurement time is as many as 1-2 seconds? Is that expected/normal? Please look at the specifics and code above and let me know what I can do, that seems like it wouldn’t be fast enough to do some of the things we would need. Thank you again for your mentorship and assistance!
No, such a duration is far longer than expected.
What is displayed with your setup in the Sanderling.exe UI under Interface → last measurement → summary at duration/ms?
At the moment, there are tasks in my queue which are more effective in helping people. There are improvements to be made which help in more than just one specific scenario for one person.
You can find out what is so special about your setup to make it take that much time.
I would start with splitting contribution to slowness in two areas: machine and software you built.
If you are not sure about this division, look at the reference method in the Sanderling.exe UI under Interface → last measurement → summary at duration/ms
Entirely understandable. I appreciate your help greatly! If it’s any consolation, this is helping multiple people developing and making use of your software.
The first sample took about 25s, and the rest of the duration/ms are around 1000-2500ms. My CPU is an i7-4790K, 32GB of Memory running Windows Server 2016 (x64). My CPU load at the moment is 10% (running a couple VMs), but even with nothing else running these numbers stay about the same. I’m not experiencing any system lag or lag within EVE, so why it’s taking so long confuses me…
As long as the timings shown in Sanderling.exe UI are similar to what you see with the code you mentioned earlier, I do not see a reason to look into that code.
EDIT: My colleague ran the same program on Win10 Pro and was having times between 100-200ms. This is consistent with a hardware issue I’d experienced previously, and will check to see if that is affecting this as well. Please disregard.
1 Like
i guess it’s expected, as 3000 is value for botstep defined to be safe.